Page Performance Scans Explained 🆕
Lighthouse scores for every page
Written By David
Last updated 10 days ago
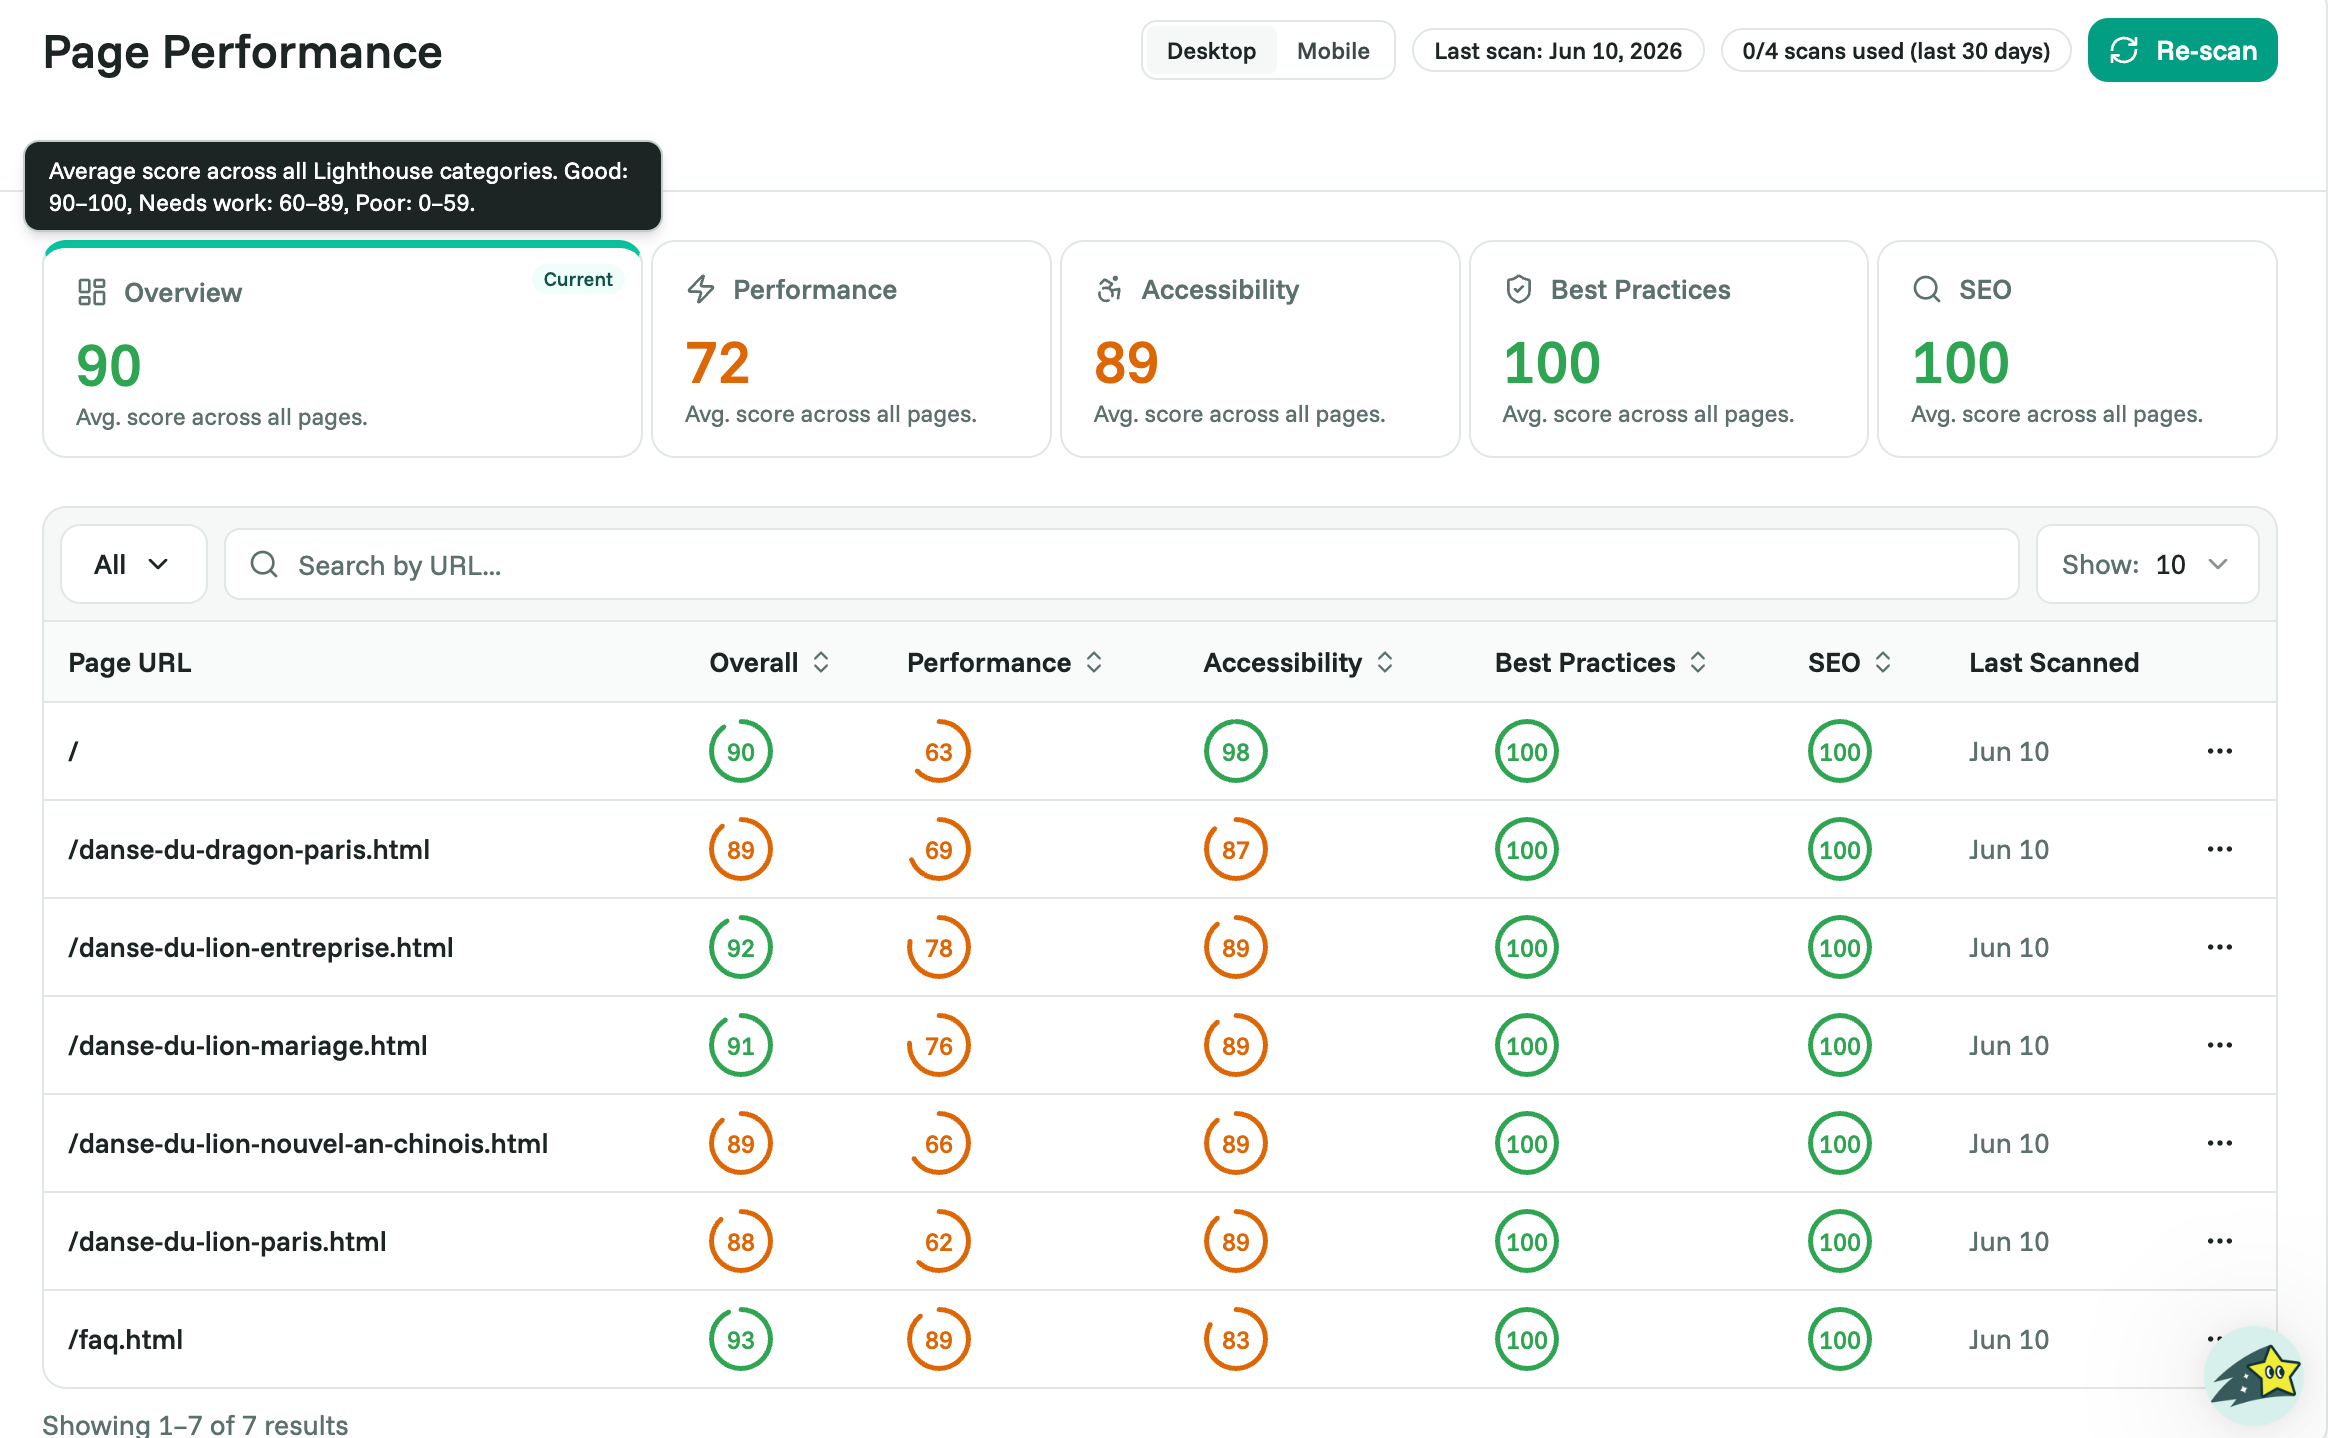
Page Performance gives every page on your site a report card. Using Google's Lighthouse tool, Cromojo scans your pages and scores them on four things that shape how visitors, and Google, experience your site.
Where to find it
Open your site in Cromojo and click Page Performance (also called Page Monitoring) in the left sidebar.
The four scores
Each page gets a score from 0 to 100 in four areas:
Performance, how fast the page loads and becomes usable. Slow pages lose visitors.
Accessibility, how easy the page is to use for people with disabilities and assistive tech.
Best Practices, whether the page follows modern, secure web standards.
SEO, whether the page is technically set up to rank well in search.
You'll also see an average score across all your pages for each area, plus a sortable table so you can spot your weakest pages fast.
Desktop vs. mobile
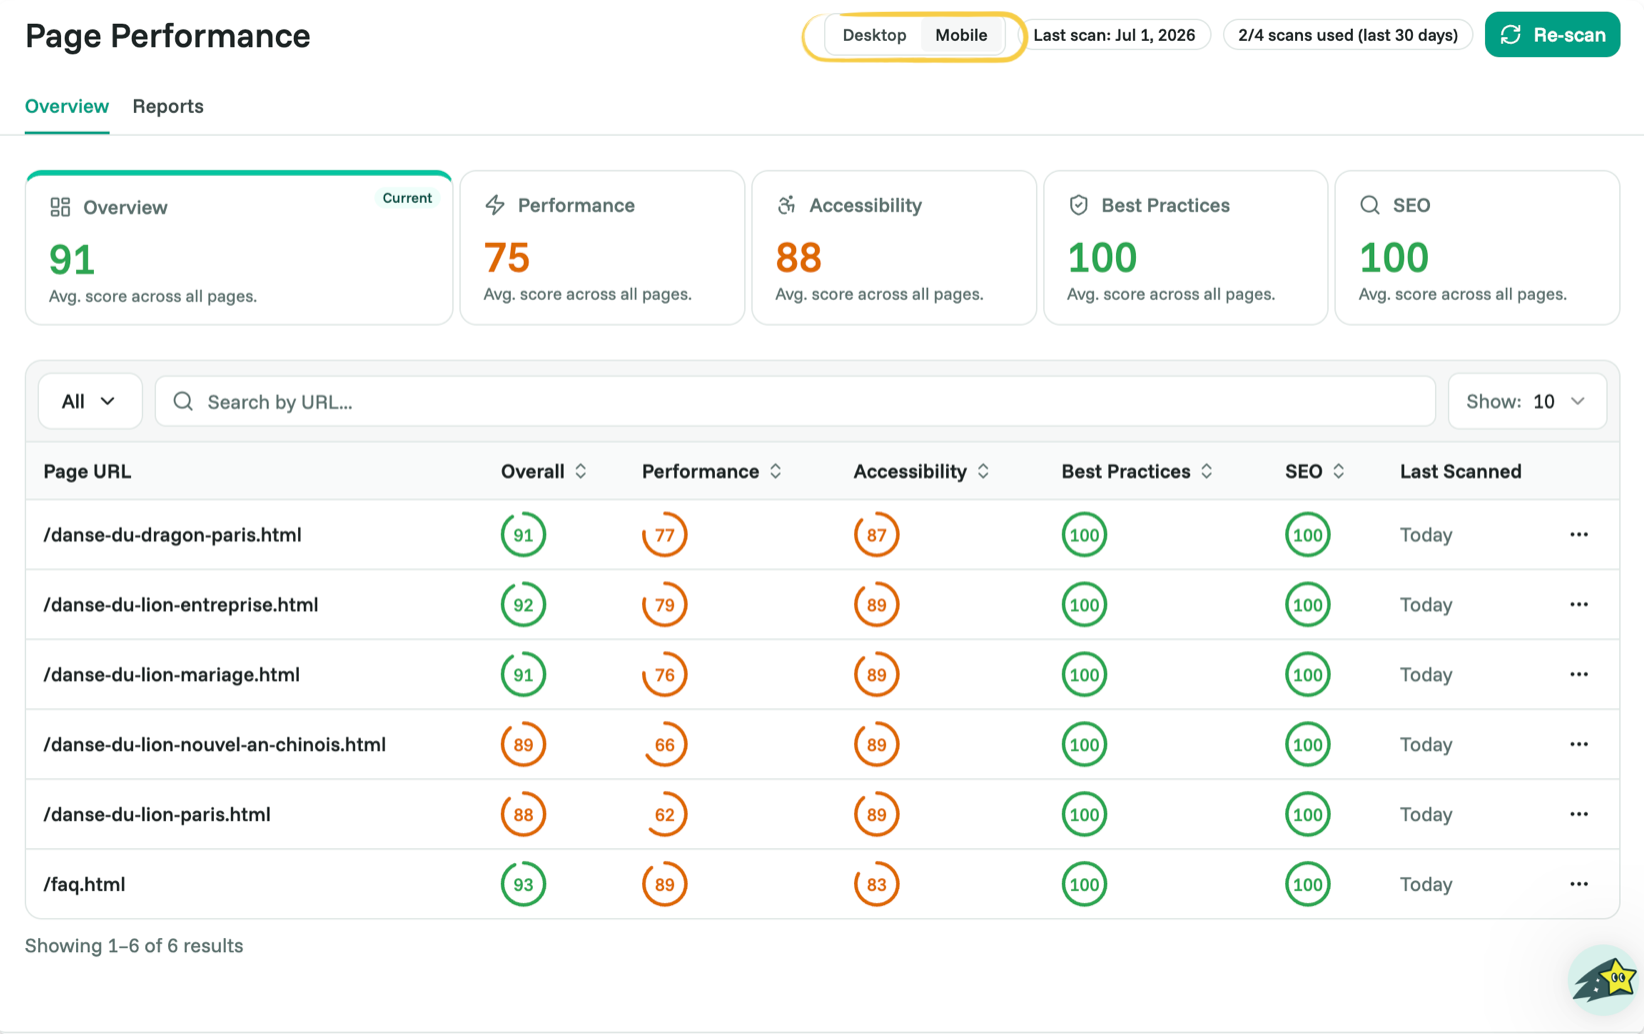
Use the Desktop / Mobile toggle at the top. Mobile scores are usually lower, and they matter most, because Google judges your site mainly by its mobile version. If you only fix one, fix mobile.
How to read your scores
As a rule of thumb: green (90–100) is good, orange (50–89) needs work, red (0–49) needs attention. Start with your most important pages (home, top products, key blog posts) and your lowest scores, that's where improvements pay off most.
How often it runs
Cromojo scans automatically once a week, so your scores stay current without you doing anything. To run a scan on demand or choose which pages get scanned, see Running & Configuring Performance Scans.